Blog · Data Visualization
A 13% price hike that looks like good news.
- Published
- Topic
- Chart design
- Read
- 4 min
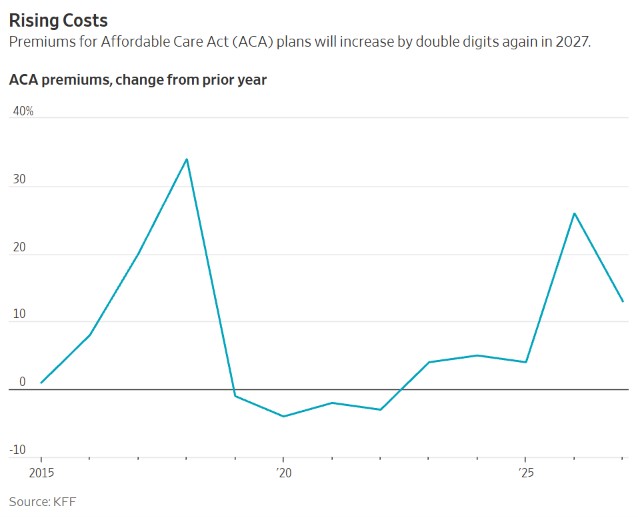
I was reading the Wall Street Journal this week and came across Anna Wilde Mathews’ piece on Affordable Care Act premiums going up again in 2027, by 13% on average according to an analysis from KFF, right on the heels of a 26% jump this year. About halfway down the article there’s a chart that made me stop and look twice, not because anything in it is wrong, but because of what my eye did with it before the rest of my brain caught up.
The chart
Here it is. Give it the kind of quick glance most of us give a chart in the middle of a news story, and notice which way the line is heading when it reaches the right edge.
What my eye saw first
My first read was that premiums spiked in 2026 and were already on their way back down. The line peaks at 26 and drops to 13, and when a line falls we tend to assume whatever it measures is falling too, since most of the line charts we see day to day, like stock prices or home values, plot an amount rather than a change in that amount.
To be fair to the Journal, nothing here is hidden. The title says “Rising Costs,” the label says “change from prior year,” and the article spells out the dollar amounts in the paragraph just above the chart. The trouble is that the shape of the line tells close to the opposite story from the words sitting on top of it, and when the shape and the words disagree, the shape is usually what people remember.
What the line is actually measuring
Every point on this chart is a rate, how much more or less premiums cost compared with the year before. Going from 26 down to 13 means prices went up by a smaller amount than they did last time, which isn’t the same thing as prices going down. If you were paying $100 a month in 2026, you’d be paying about $113 in 2027, and that $113 becomes the starting point for whatever happens in 2028. As long as the line stays above zero, premiums are climbing, whichever way the line itself happens to be pointed.
That stacking effect is exactly what a rate chart hides. The chart opens in 2015 with a 1% increase that barely leaves the floor, and every year after it builds on top of the one before. If you multiply all thirteen points together, you land at roughly 2.6 times the 2014 price, a pretty important number that doesn’t appear anywhere on the chart. Even the stretch below zero from 2019 to 2022, which reads like four years of relief, only gave back $43 a month after premiums had climbed $208 over the four years before it.
The chart I’d rather see
KFF publishes the average monthly premium behind those percentages for every year since the marketplaces opened in 2014, so I charted the dollar amounts instead. It’s the same plan the percentages are based on, the benchmark silver plan for a 40-year-old.
Now the picture matches the headline. Premiums have gone from $273 a month in 2014 to $704 in 2027, and the year that looks like a retreat on the Journal’s chart is the tallest bar on this one. The 13% rise for 2027 works out to $79 more a month, the third-largest dollar increase in the whole series, behind only this year’s $128 and the $122 jump in 2018.
It also lets a reader find the number they actually care about. Someone deciding whether they can afford a plan next year is thinking about $704 a month, or about $8,448 for the year, and not about whether this year’s increase was smaller than last year’s. The rate chart needs the reader to do compounding math in their head to get there, while the bar chart just shows it.
A caveat on those dollars
These are full sticker prices for one plan at one age, averaged across the country. Most people who buy through the ACA marketplaces get a federal subsidy that brings what they pay well below this, and premiums vary a lot by state and by age. The article notes that those subsidies were cut back sharply at the start of this year, which is part of why the full price matters to more people now. None of that changes the point about the chart, though, since the percentages and the dollar amounts come from the same KFF figures.
What I’m taking from it
A rate of change is a perfectly good thing to chart when the question is about speed, like whether increases are picking up or easing off. When the question is what something costs, I’d chart the cost. And if I ever put a percent change on a dashboard of my own, I want the actual amount sitting right next to it, or at least written into the labels, so nobody walks away thinking a price went down in a year when it went up by 13%.
Sources
Article: Anna Wilde Mathews, “Affordable Care Act Rates to Rise Steeply—Again”, The Wall Street Journal, October 30, 2026. Premium data: KFF, Marketplace Average Benchmark Premiums. The Journal’s chart is reproduced here for commentary and belongs to its creators; the bar chart is my own, drawn from KFF’s published figures.