Diabetes Care Scorecard · Healthcare, synthetic data
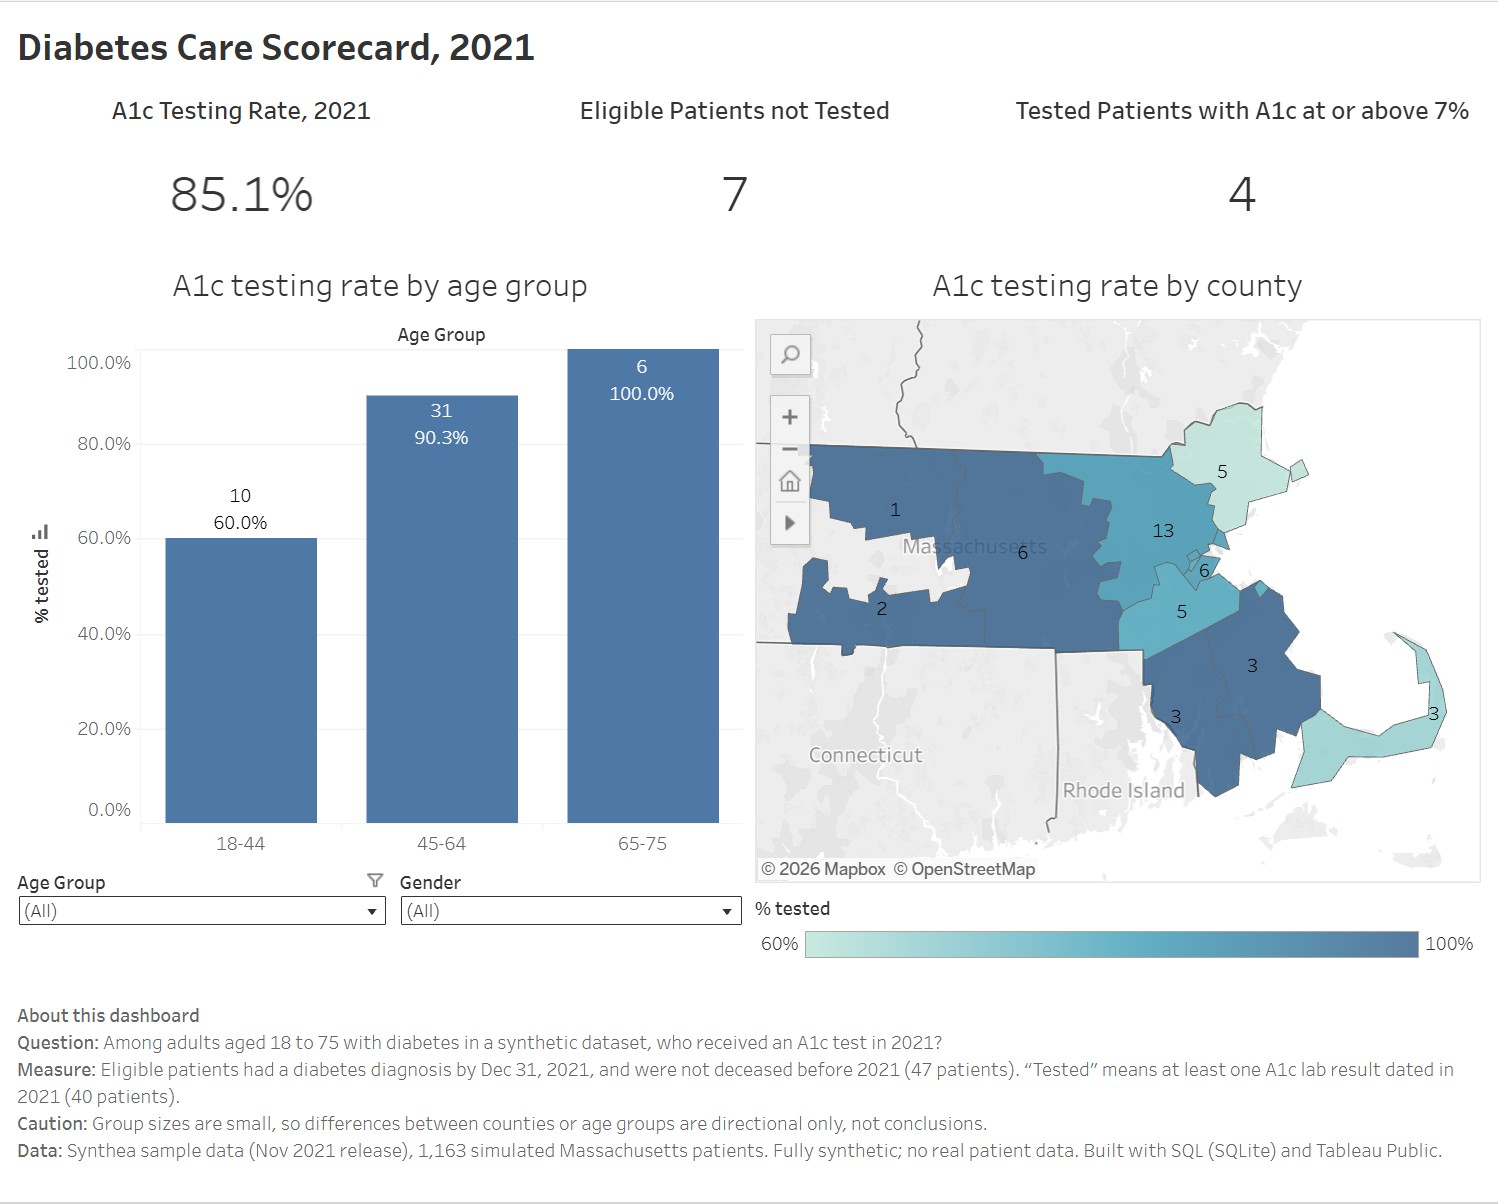
Most adults with diabetes in this data had their A1c checked in 2021. The useful part is the list of the seven who didn’t.
- Role
- Sole analyst
- Stack
- SQL (SQLite), Tableau Public
- Status
- Complete · synthetic data
The question
Health plans track a simple quality measure for adults with diabetes: did they have an A1c test during the year? A1c is a blood test that reflects average blood sugar over the past few months, and the patients who miss it are the ones worth a phone call.
So the question was: among adults aged 18 to 75 with diabetes, who received an A1c test in 2021, and where are the gaps? I wanted to answer it the way a health data analyst would: define exactly who counts, measure how many were tested, and turn the gap into a list someone could act on.
The data
Real patient records are private, so this uses Synthea’s sample data: 1,163 simulated Massachusetts patients, with no real person behind any record. It has the same tables a health system would, patients, diagnoses, lab results and visits, and some of the same mess. I loaded twelve of its tables into SQLite and wrote the analysis there.
The measure
- Year
- 2021, the last year in the data (it ends in November 2021).
- Eligible
- A diagnosis recorded as exactly “Diabetes”, not prediabetes, starting by December 31, 2021; aged 18 to 75 on that date; and not deceased before 2021.
- Tested
- At least one A1c result (lab code 4548-4) dated in 2021.
It measures whether the test happened, not whether the result was good. That is the same split health plans make between care measures and control measures.
What it showed
- 85.1% were tested: 40 of the 47 eligible patients had an A1c result in 2021.
- The 7 who weren’t had all been tested before. Each had an A1c in 2019 or 2020, then none in 2021. They had been part of the routine and dropped out of it, which is exactly who a follow-up call is for.
- Younger patients were tested less: 6 of 10 aged 18 to 44, against 28 of 31 aged 45 to 64 and all 6 aged 65 to 75. With groups this small, that is a direction worth checking, not a conclusion.
- 4 of the 40 tested had a latest result at or above 7%.
Where the data pushed back
Twice, the data forced a change of plan.
- I planned a “poor control” measure, an A1c above 9%. It returned 0 of 40, so the dashboard uses “at or above 7%” instead.
- I planned to compare providers. The 47 patients were spread across more than 40 organizations, so most groups held one or two patients. County was the next best grouping, and even there the largest group is 13.
The data has quirks too. Of 4,780 A1c readings in the whole dataset, 1,197 are under 4%, which is implausibly low, and 10 of the 40 tested patients have a latest result in that range. Results are stored as text and need casting, and dates come in two formats depending on the table. With only 47 eligible patients, every breakdown here is directional.
Dashboard page two · Chronic condition burden
Which chronic conditions show up together, and what happens to the cost of care as they add up?
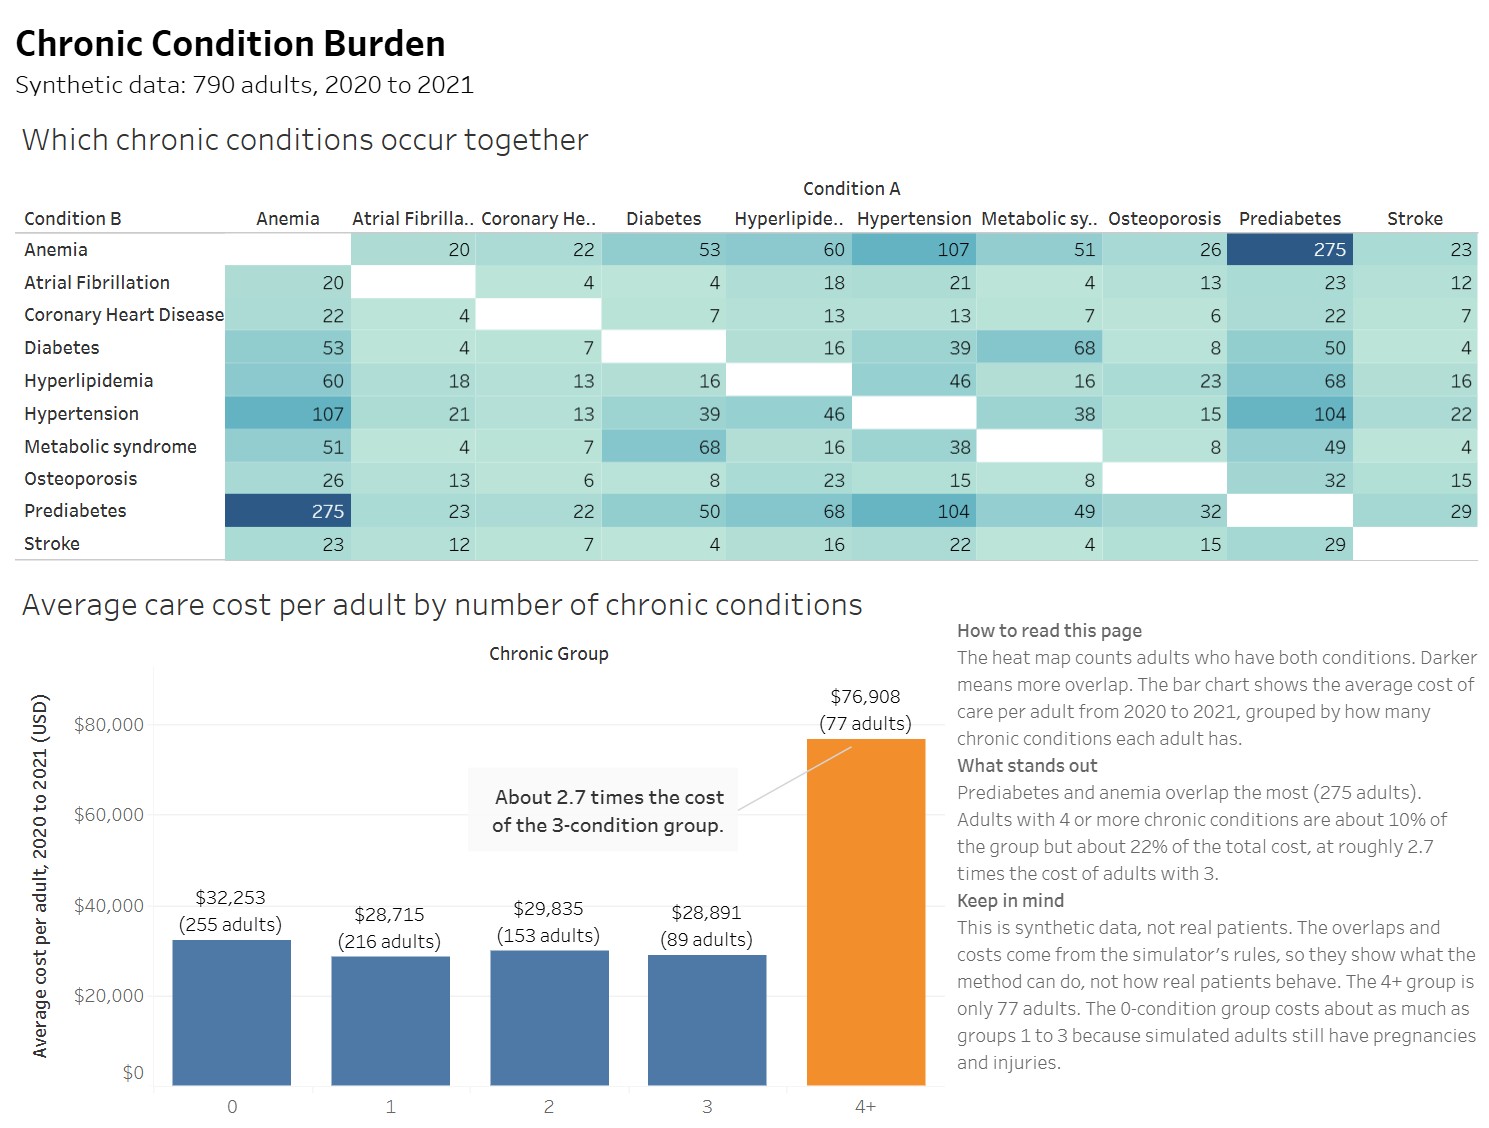
The A1c measure looks at one disease. For the second page of the dashboard I widened the view to all adults and ten chronic conditions, from hypertension and diabetes to stroke and anemia, to see which ones tend to appear together and how the cost of care changes as a person’s count goes up.
How it was built
The group is 790 adults: everyone 18 or older at the end of 2021 who was still alive at the start of 2020. Visits and costs come from those two years. I picked the ten conditions by hand, because Synthea’s conditions table also records things that aren’t diseases, like social situations and findings, so simply counting rows would have been wrong.
One join mattered more than the rest. An inner join would have quietly dropped every adult with no chronic conditions, which is the largest group. A left join keeps them, and the totals reconcile back to all 790.
What it showed
- About 10% of adults account for about 22% of the cost. Adults with four or more chronic conditions are 77 of the 790, and $5.9 million of the $27.5 million in simulated care costs.
- Cost stays flat, then jumps. The average cost per adult sits between about $29,000 and $32,000 for zero to three conditions, then reaches $76,908 at four or more, about 2.7 times the three-condition group. Visits roughly double as well, from about 7 to about 14 over the two years.
- Prediabetes and anemia overlap the most, followed by anemia with hypertension, and hypertension with prediabetes. Almost every patient with diabetes, 68 of 73, also has metabolic syndrome, which says more about how the simulator is built than about medicine.
These overlaps and costs come from the simulator’s rules, so they show what the method can do, not how real patients behave. The four-or-more group is only 77 adults. And the zero-condition group costs about as much as groups one to three, because simulated adults without a chronic condition still have pregnancies and injuries.
What I’d improve next
Run the same SQL on a larger Synthea dataset, where providers have enough patients for a comparison to mean something. The queries should run unchanged.
Add a Python step: a cleaning notebook that shows the data before and after, and a simple significance test on the age-group gap. With groups this small, that means Fisher’s exact test rather than chi-square.